Compiled by Michelle Dials for Fulton County Calendar; slides from Governor Eric Holcomb’s August 26, 2020 press conference
The Indiana State Department of Health will be updating its color-coded county positivity map. The map will go live on the dashboard on Wednesday, Sept. 2 and be updated weekly. A map as of Aug. 26, 2020 is available here.
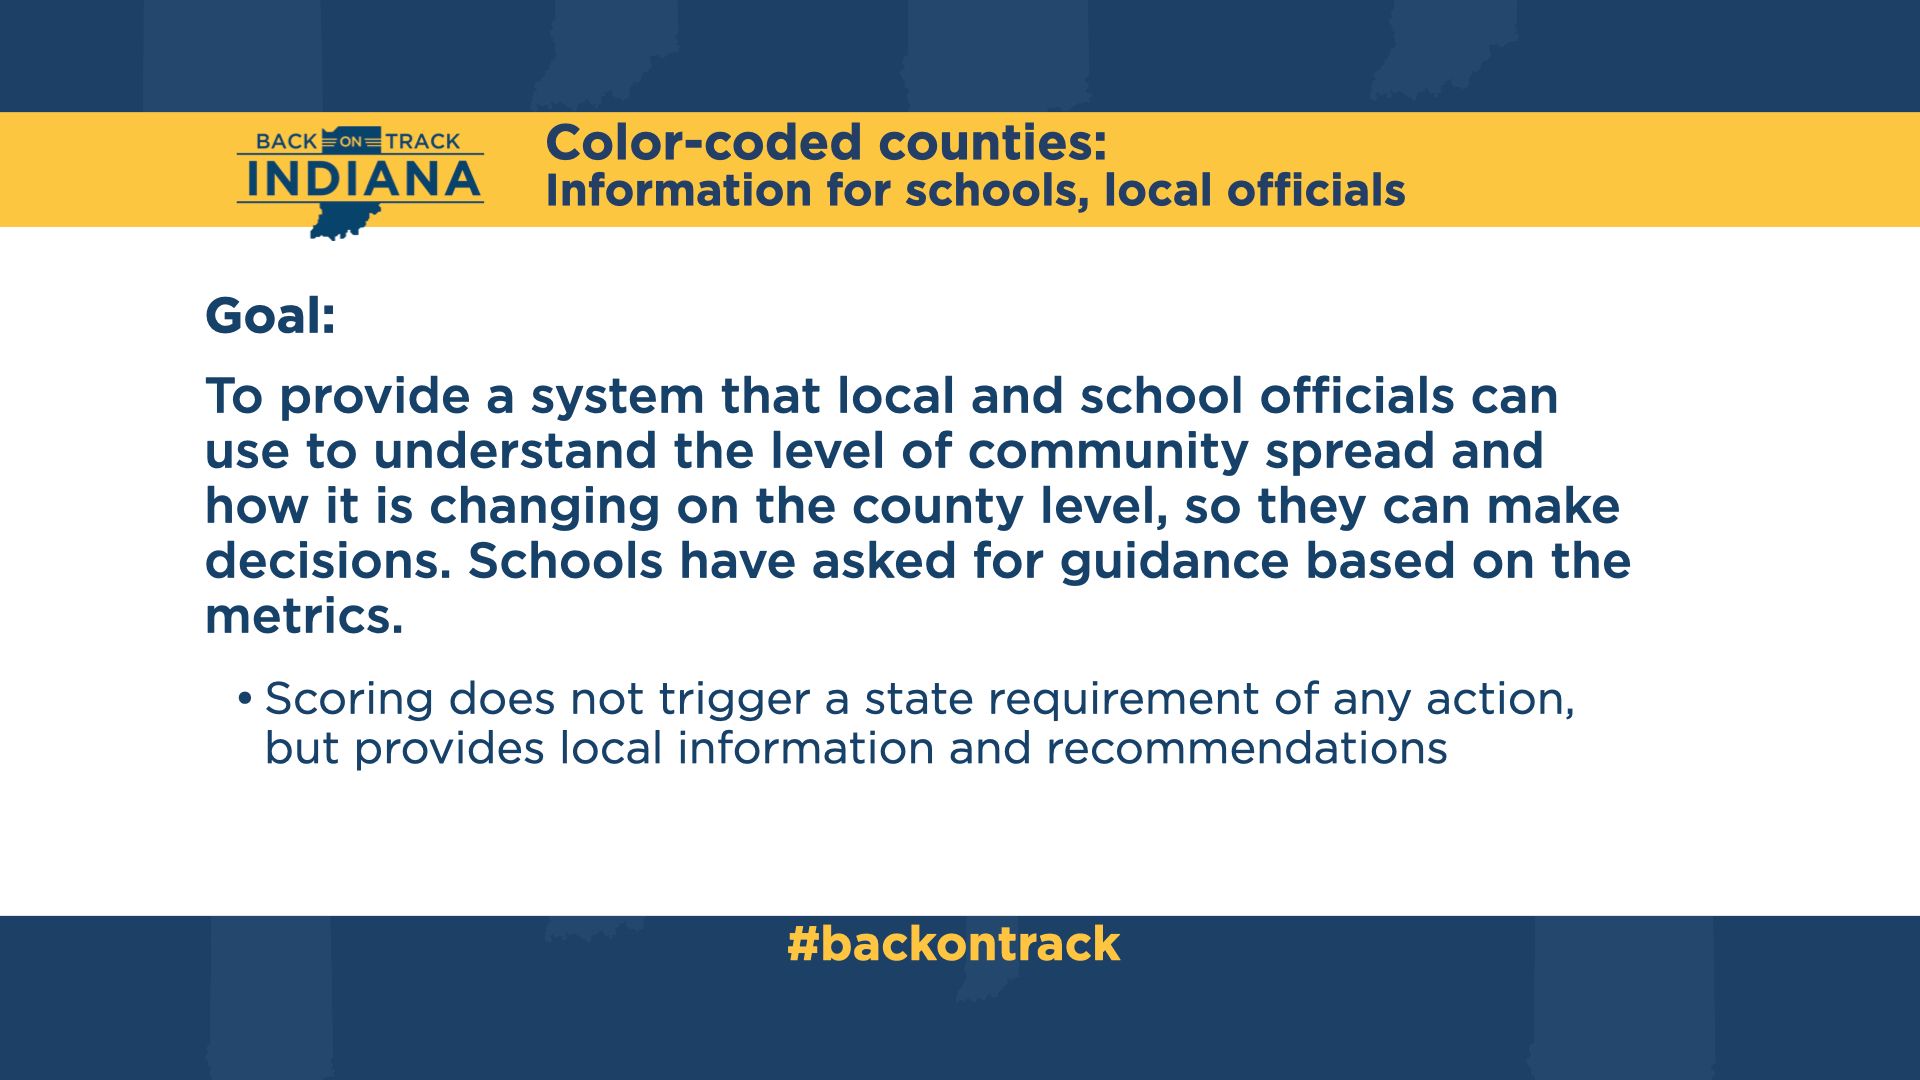
The goal is to provide a system local and school officials can use to understand the level of community spread of COVID-19, and how it is changing on the county level.
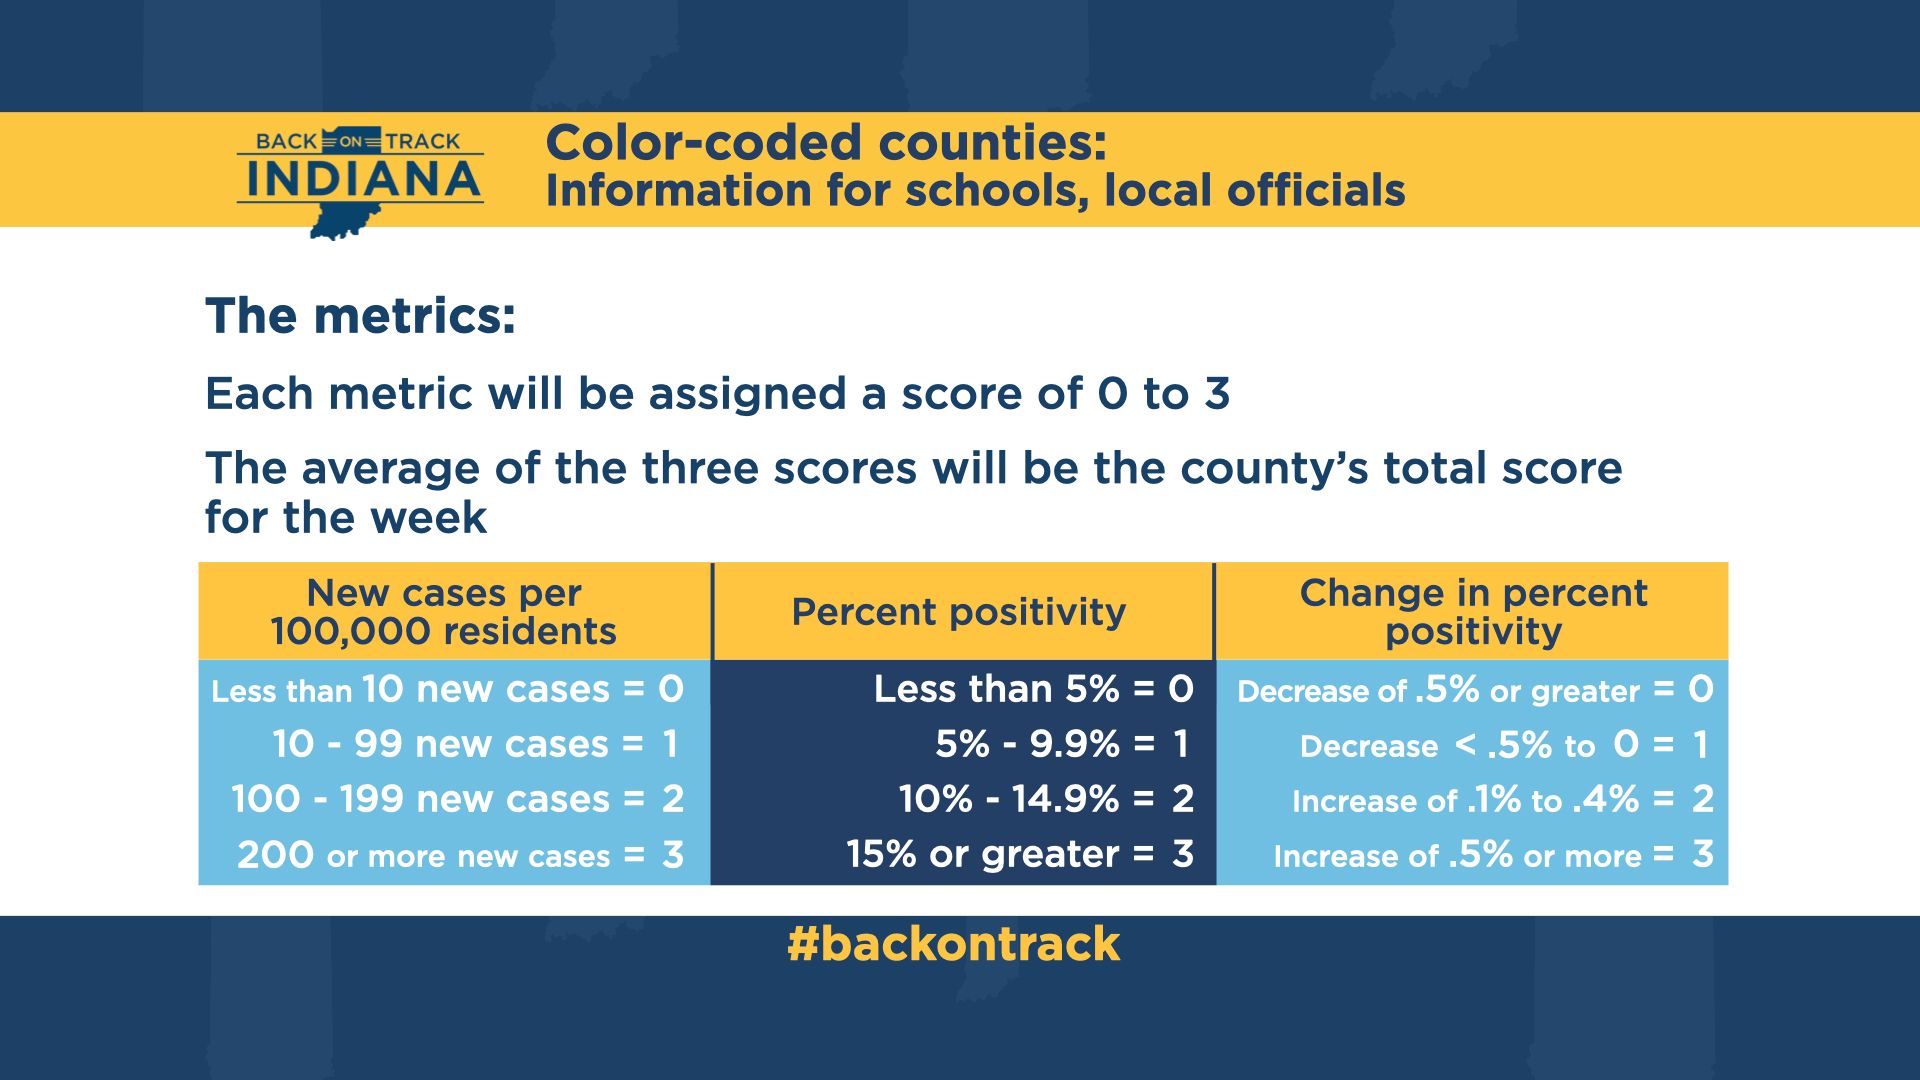
Counties will be scored based on three metrics (new cases per 100,000 residents, percent positivity based on total number of tests administered, and change in percent positivity from the previous week) and their total score for the week will be the average of those three scores.
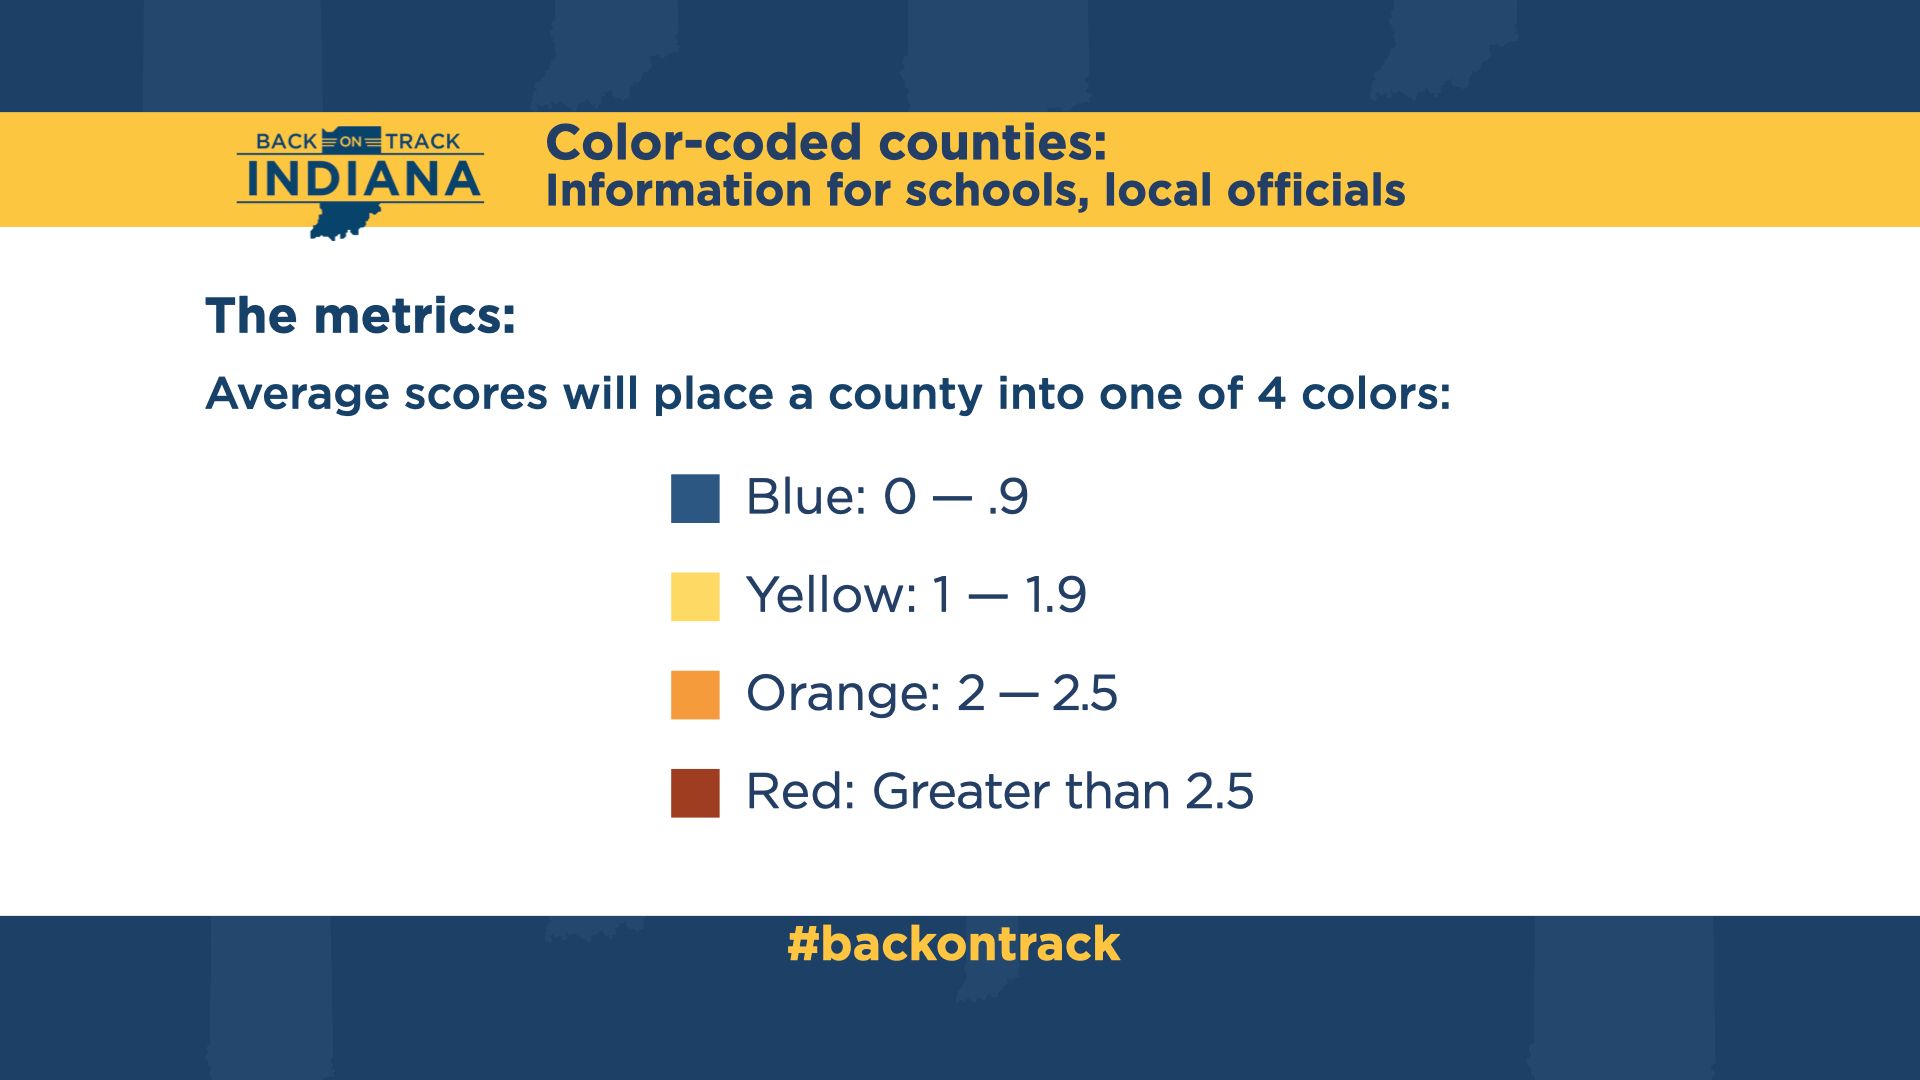
The four scores are:
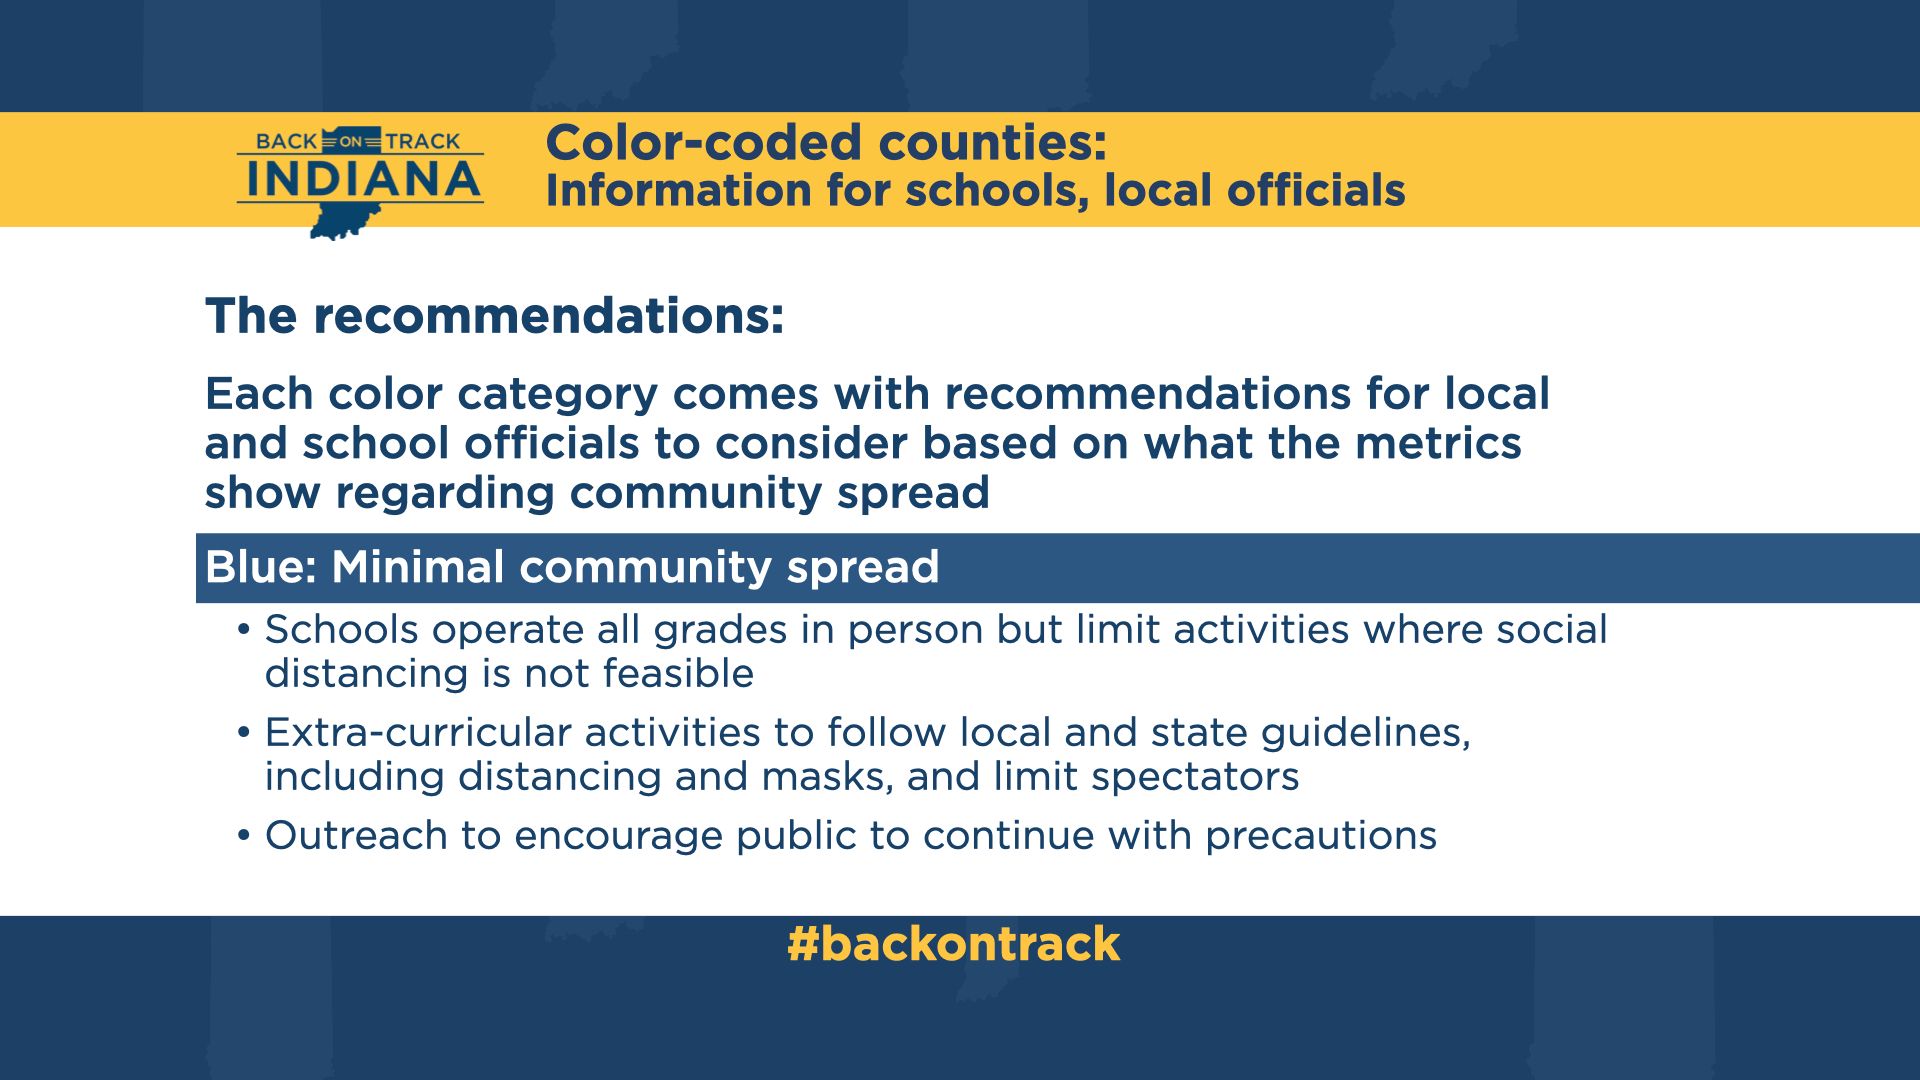
- Blue: 0-.9 (Minimal Community Spread)
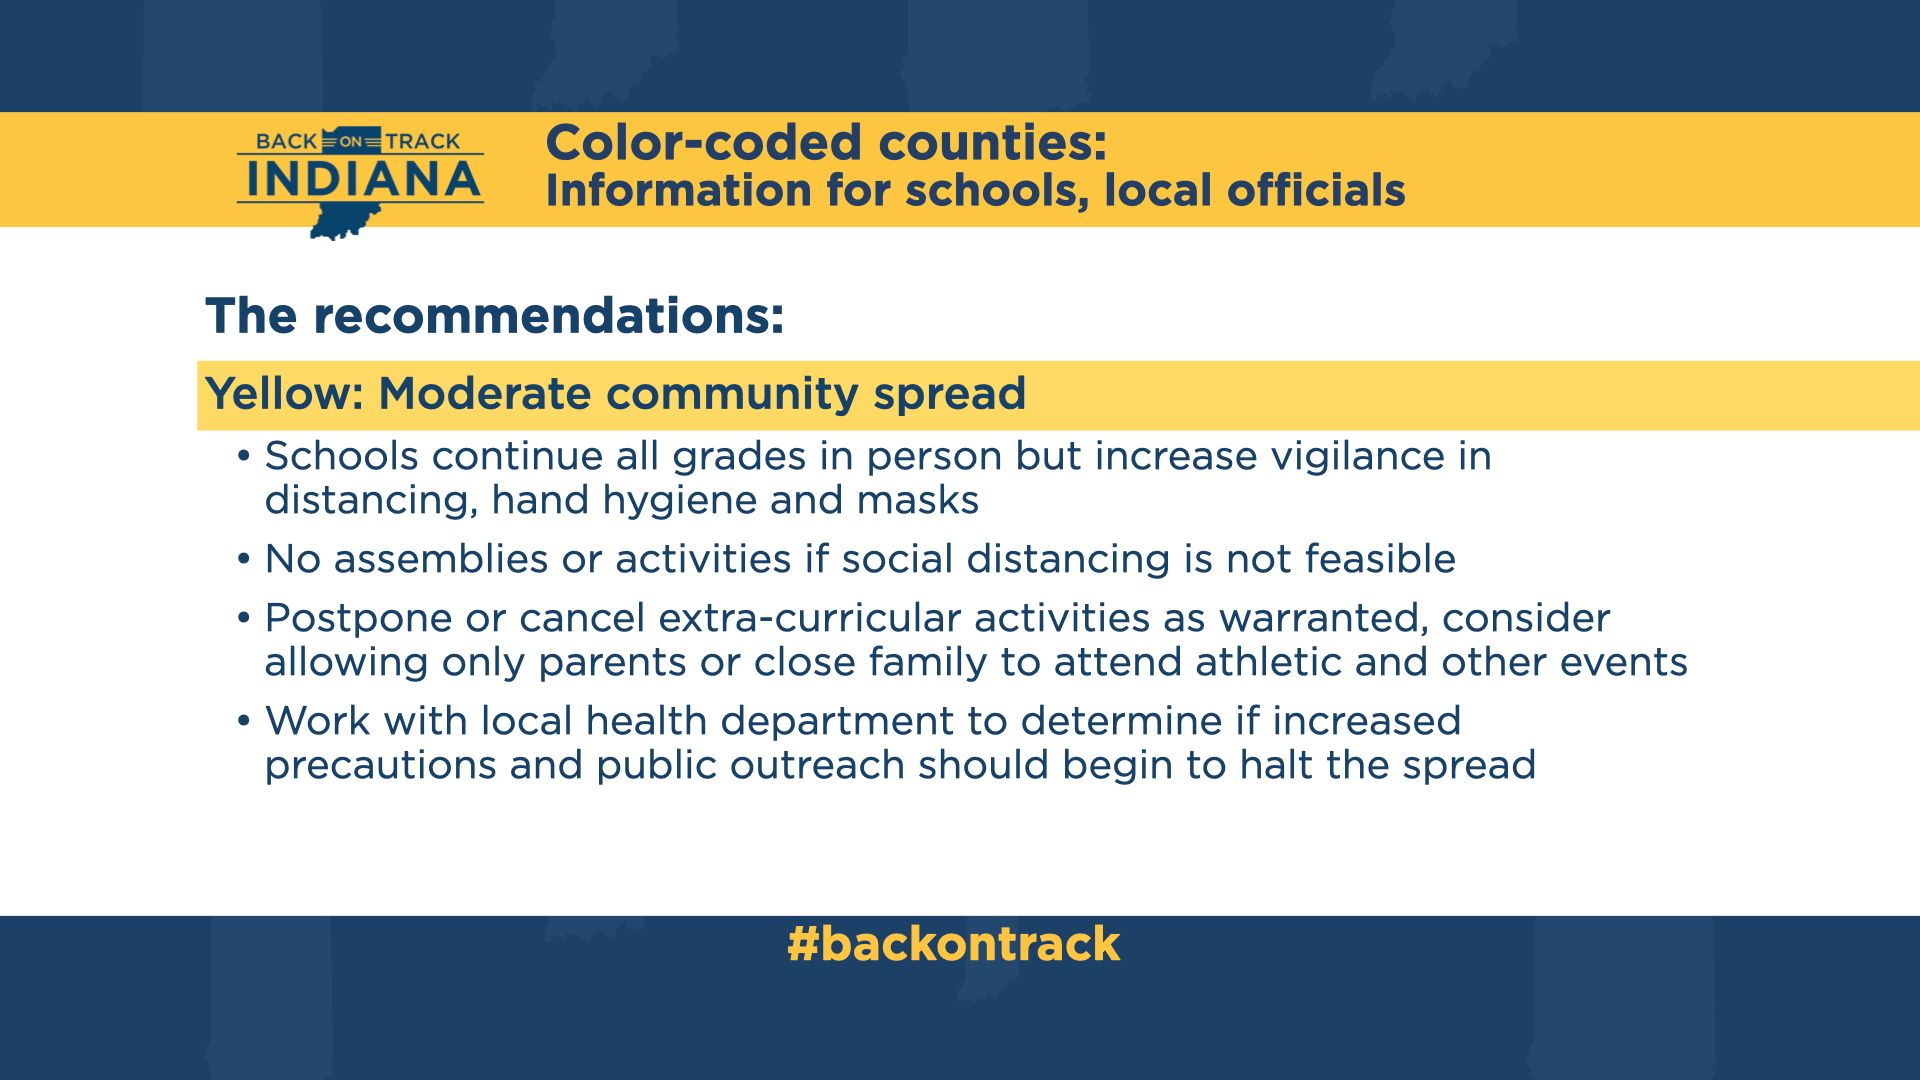
- Yellow: 1-1.9 (Moderate Community Spread)
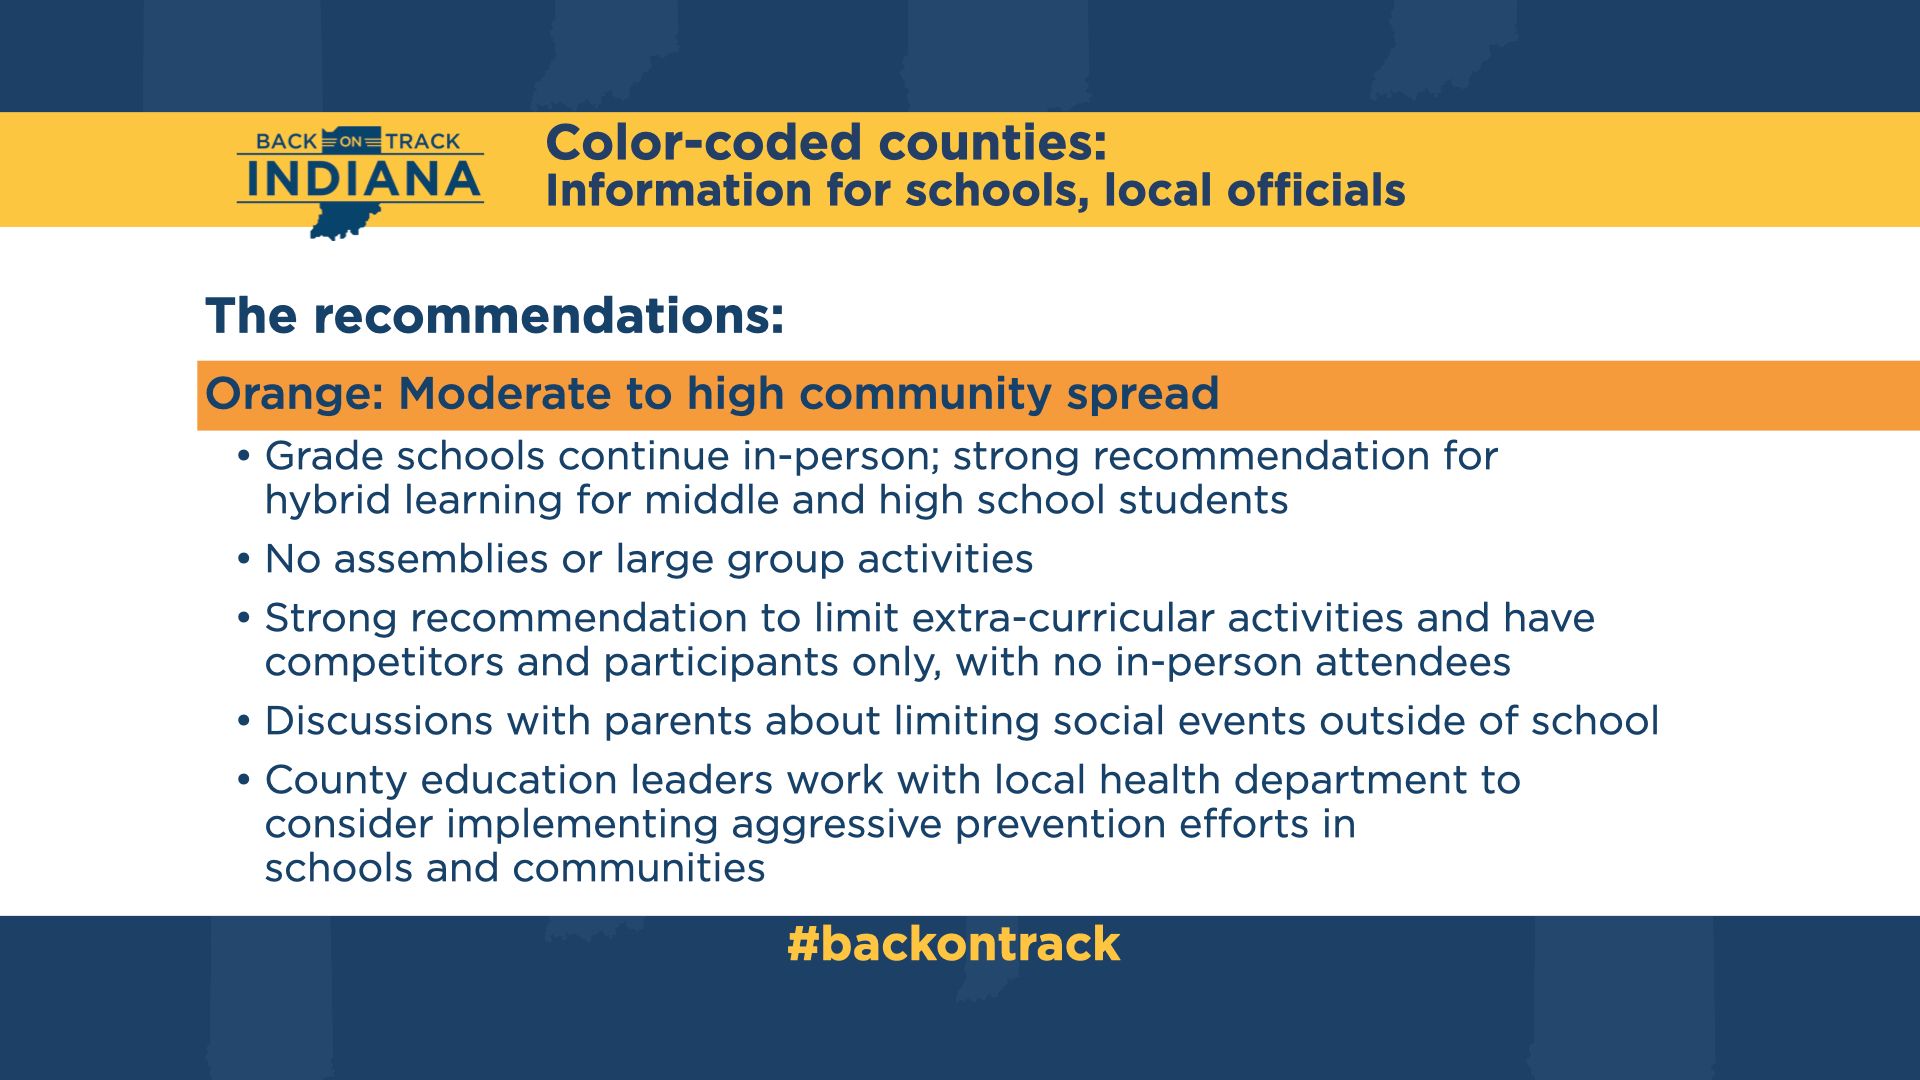
- Orange: 2-2.5 (Moderate to High Community Spread)
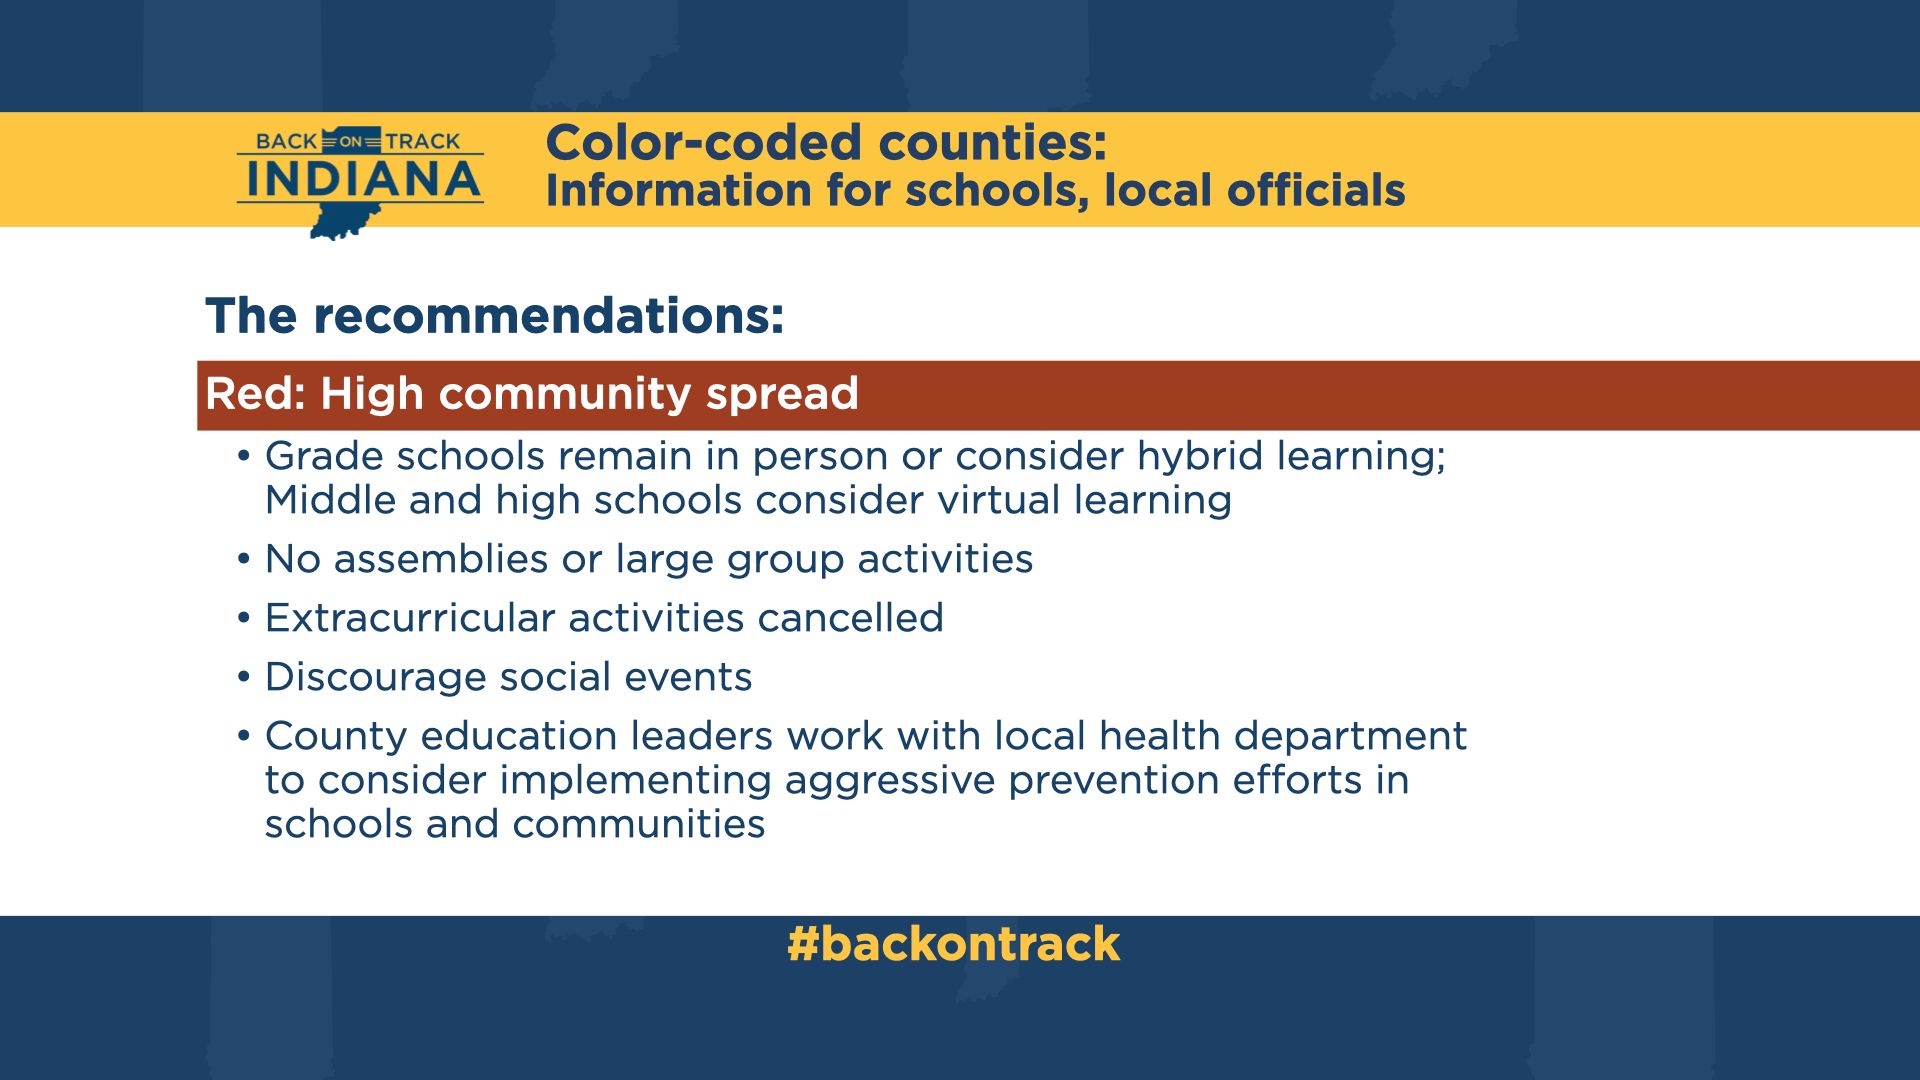
- Red: Greater than 2.5 (High community spread)
Here are the recommendations for each stage:
